
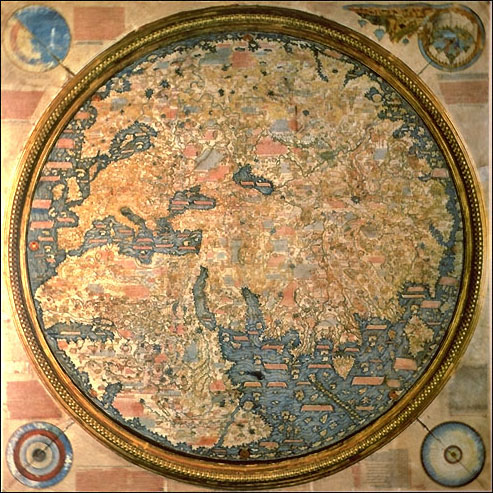
Sinusoidal Map Projection of the Earth
This projection is an equal area map projection. It shows relative sizes accurately, but distorts shapes and directions.
https://users.cs.jmu.edu/bernstdh/web/common/lectures/images/projection_sinusoidal_world.gif


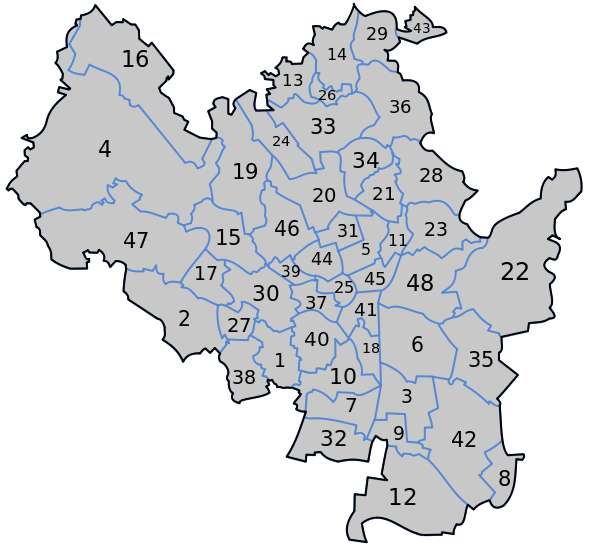
 Unclassed Bivariate Map


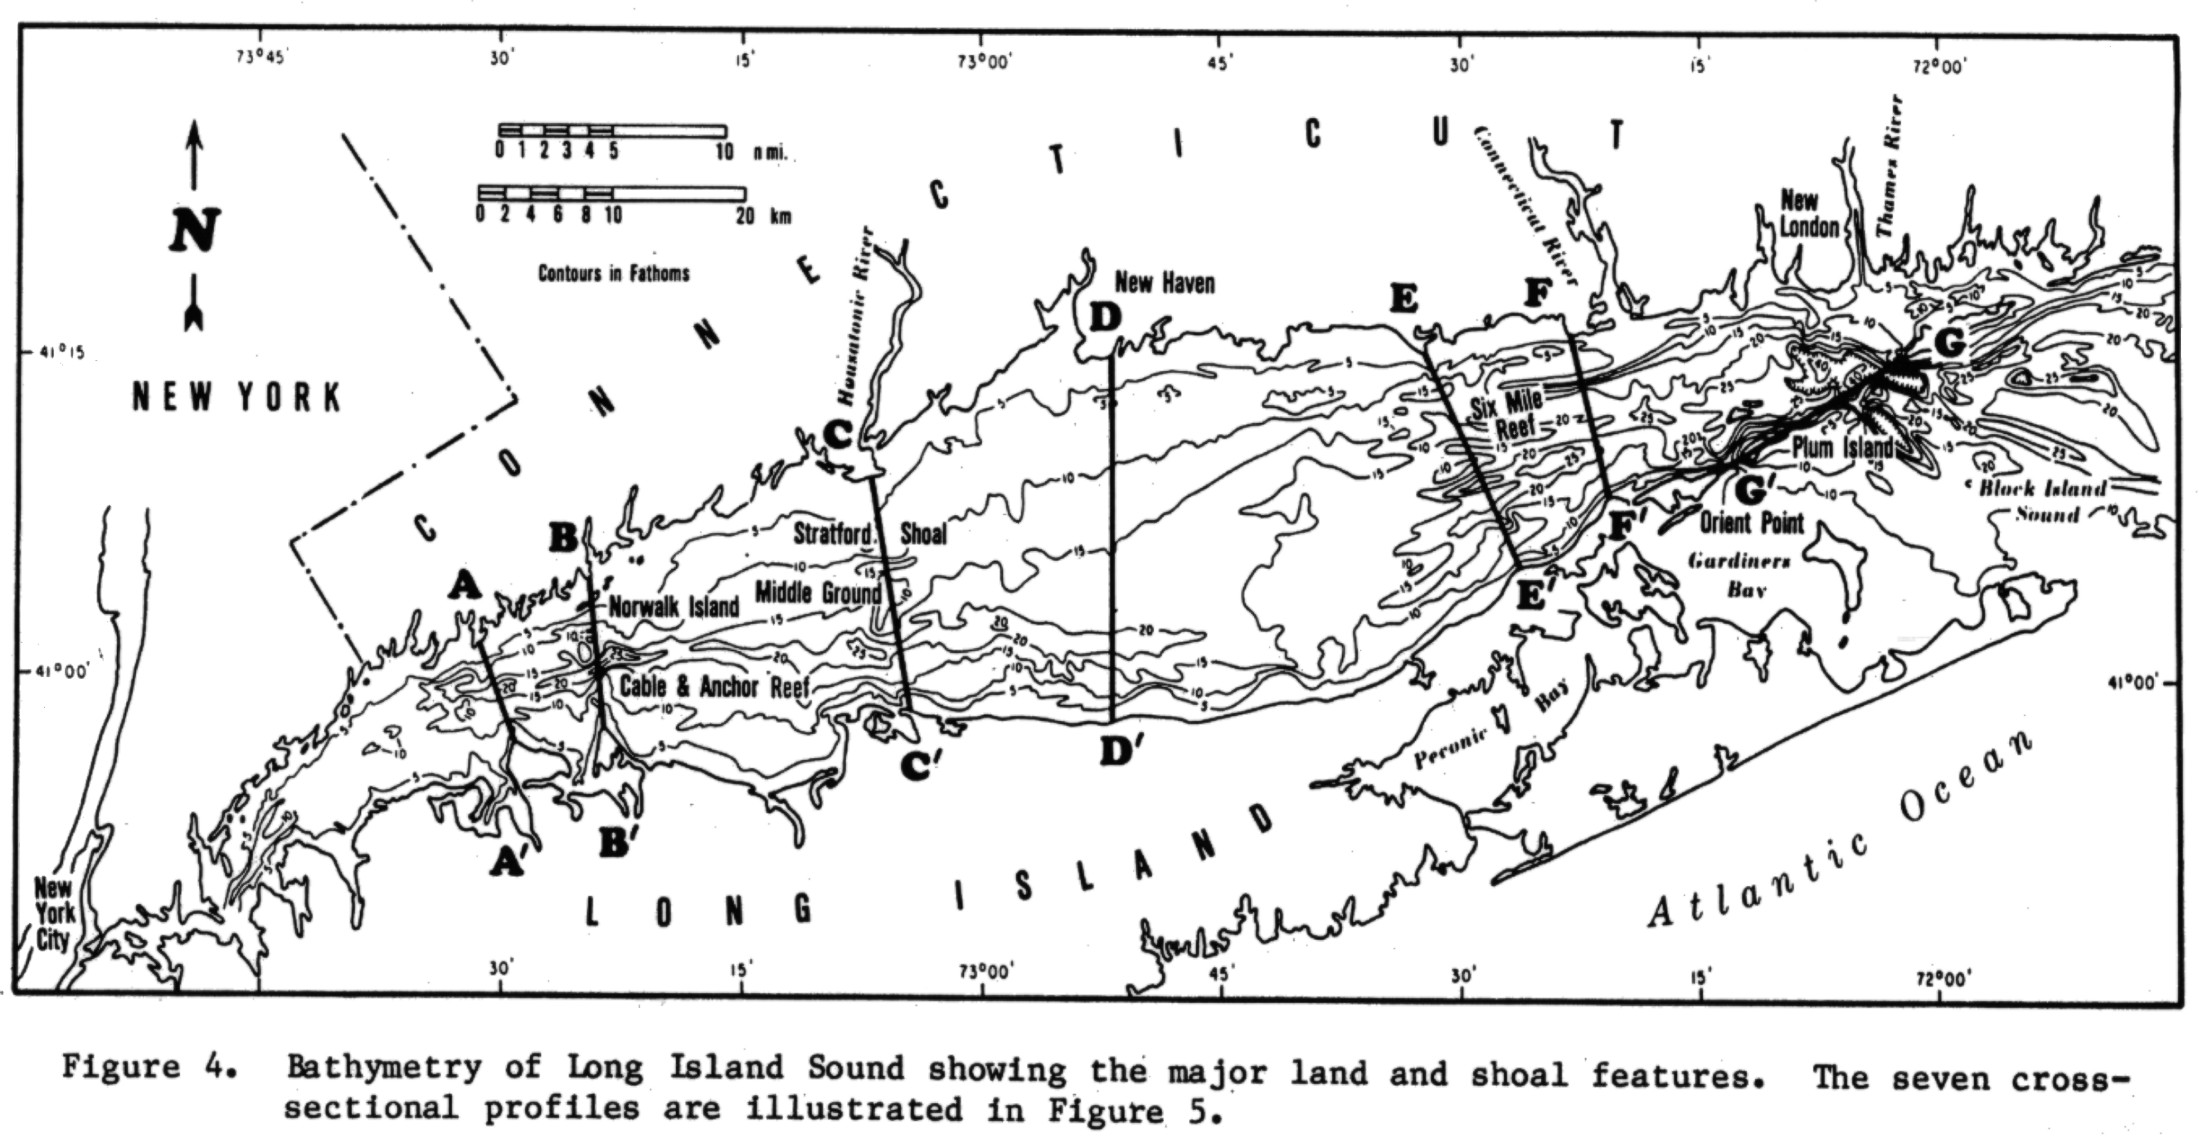
 Planimetric Map


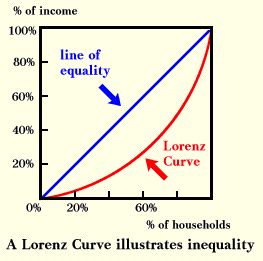